Parkinson's Disease Blood Transcriptomics
The aim of this tool is to visualize the expression of circRNA and linearRNA in Parkinson disease. We leverage data from 1,848 participants and 1,789 circRNAs from two of the largest publicly available studies, PDBP and PPMI, which include longitudinal clinical and blood transcriptomic data. To comprehensively understand changes in circRNA, we performed a cross-sectional study utilizing the last visit of each participant (N=1,848) and a longitudinal (mixed model) analysis that included 1,166 participants with at least two time points. For more details on the cross-sectional and longitudinal analyses, please refer to the paper by Beric et al., 2024 . Detailed descriptions of both the PDBP and PPMI datasets can be found below.
The dataset includes 1,177 participants of European descent, which includes 460 healthy controls (251 femalse and 209 males), mean age is 62.83 and 717 parkinson disease (269 femals and 448 males), meaan age is 65.85 as discovery dataset
To explore more, visit the study page .
The dataset includes 671 participants of European descent, which includes 143 healthy controls (52 femalse and 91 males), mean age is 63.93 and 528 parkinson disease (203 femals and 325 males), meaan age is 64.33 as replication dataset. The dataset includes more than 60% male participants.
To explore more, visit the study page .
Parkinson's Disease Blood Transcriptomics
Model Results
Count Distribution
Count Distribution
.
How to Use
This application helps to visualize the expression of circular and linear RNA in Control, PD, and Prodromal individuals. In this page, we can see how user can use this application. Figure 1 shows home page of this tool.

Figure 1. Snapshot of home page.
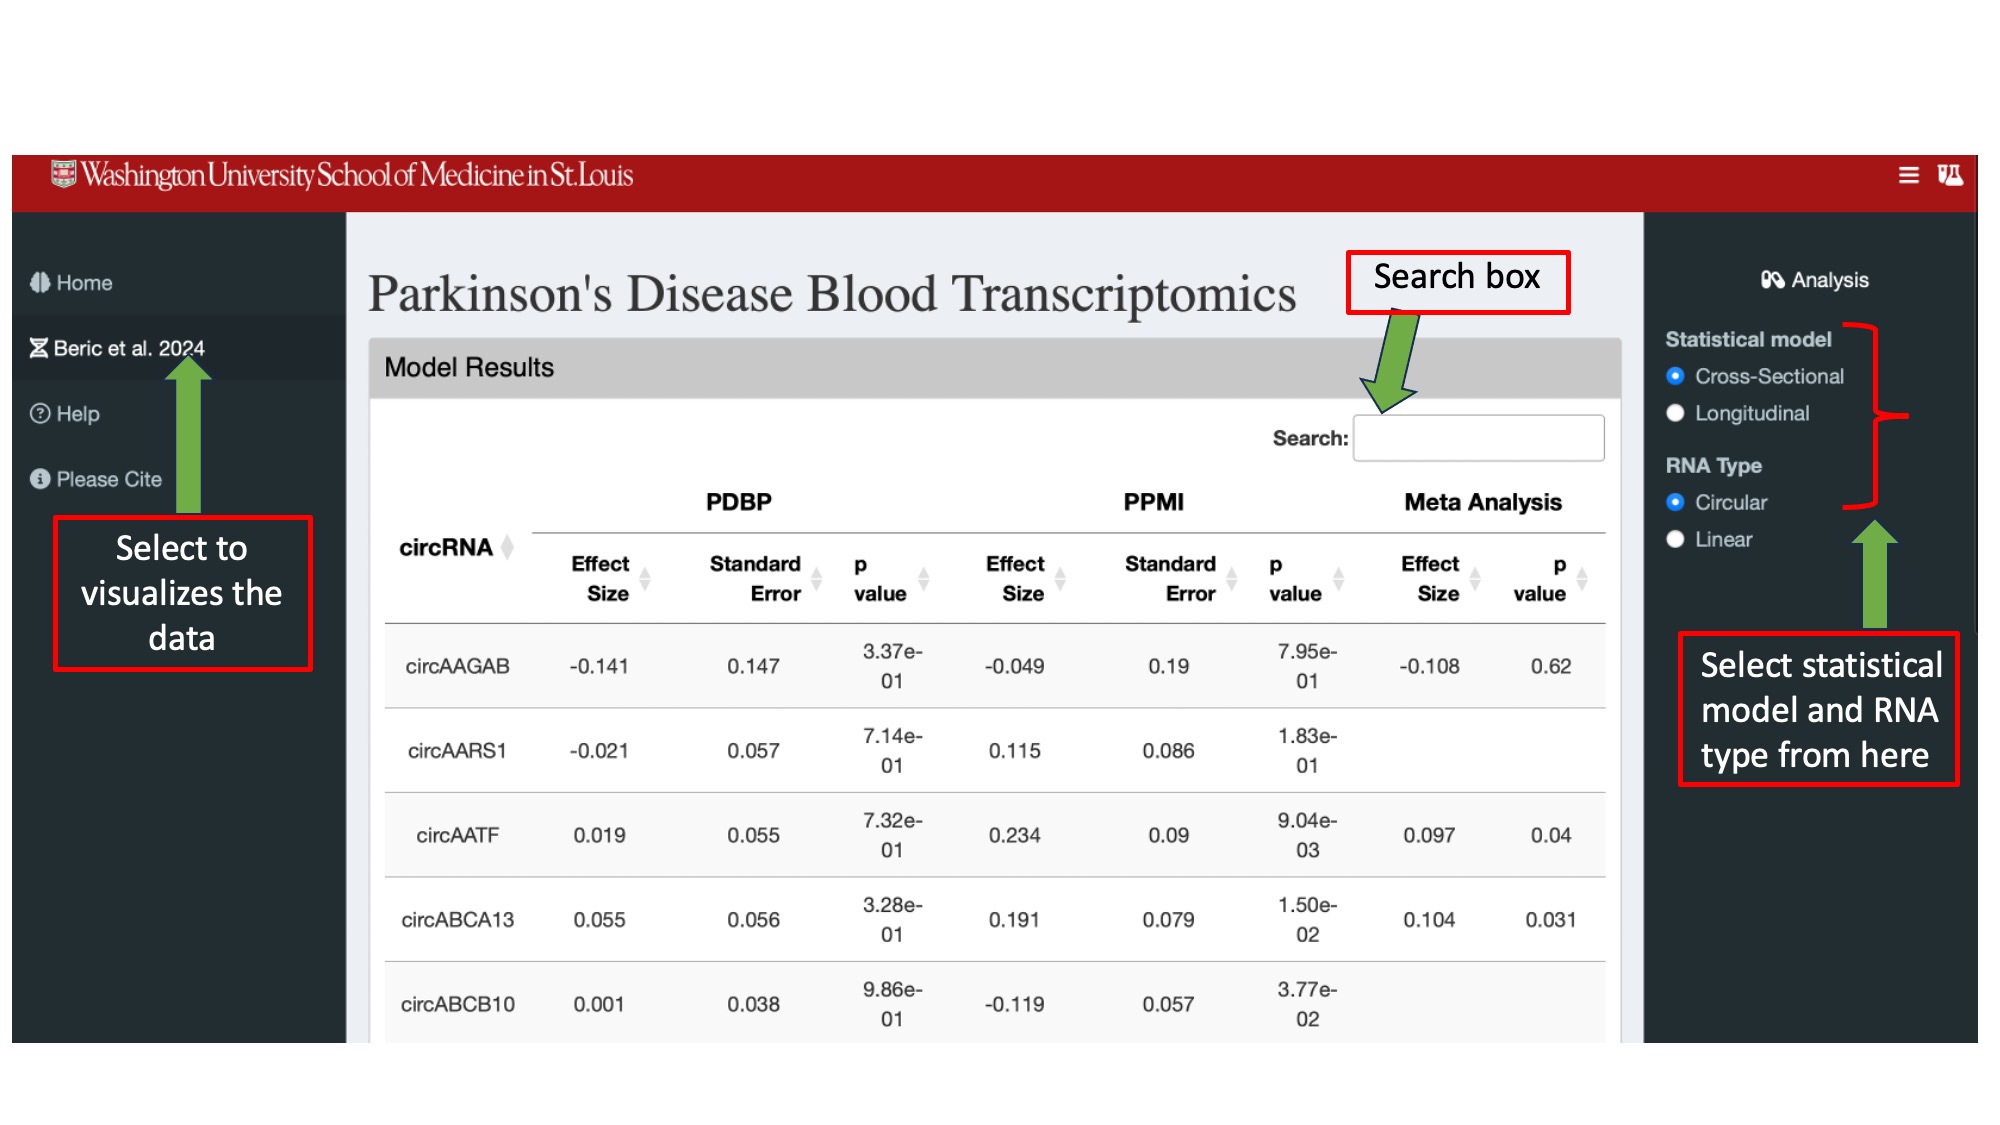
Figure 2 represents search page and output in tabular form. In this page, we can select the stastical model as well as RNA type. To know more about the stastical model, please see the research paper Beric et al 2024. For the user convenant, We also provided the search box to search specific RNA. This page shows the circular RNA from cross-sectional model.

Figure 2. Figures shows how to select stastical model and RNA type for searching.
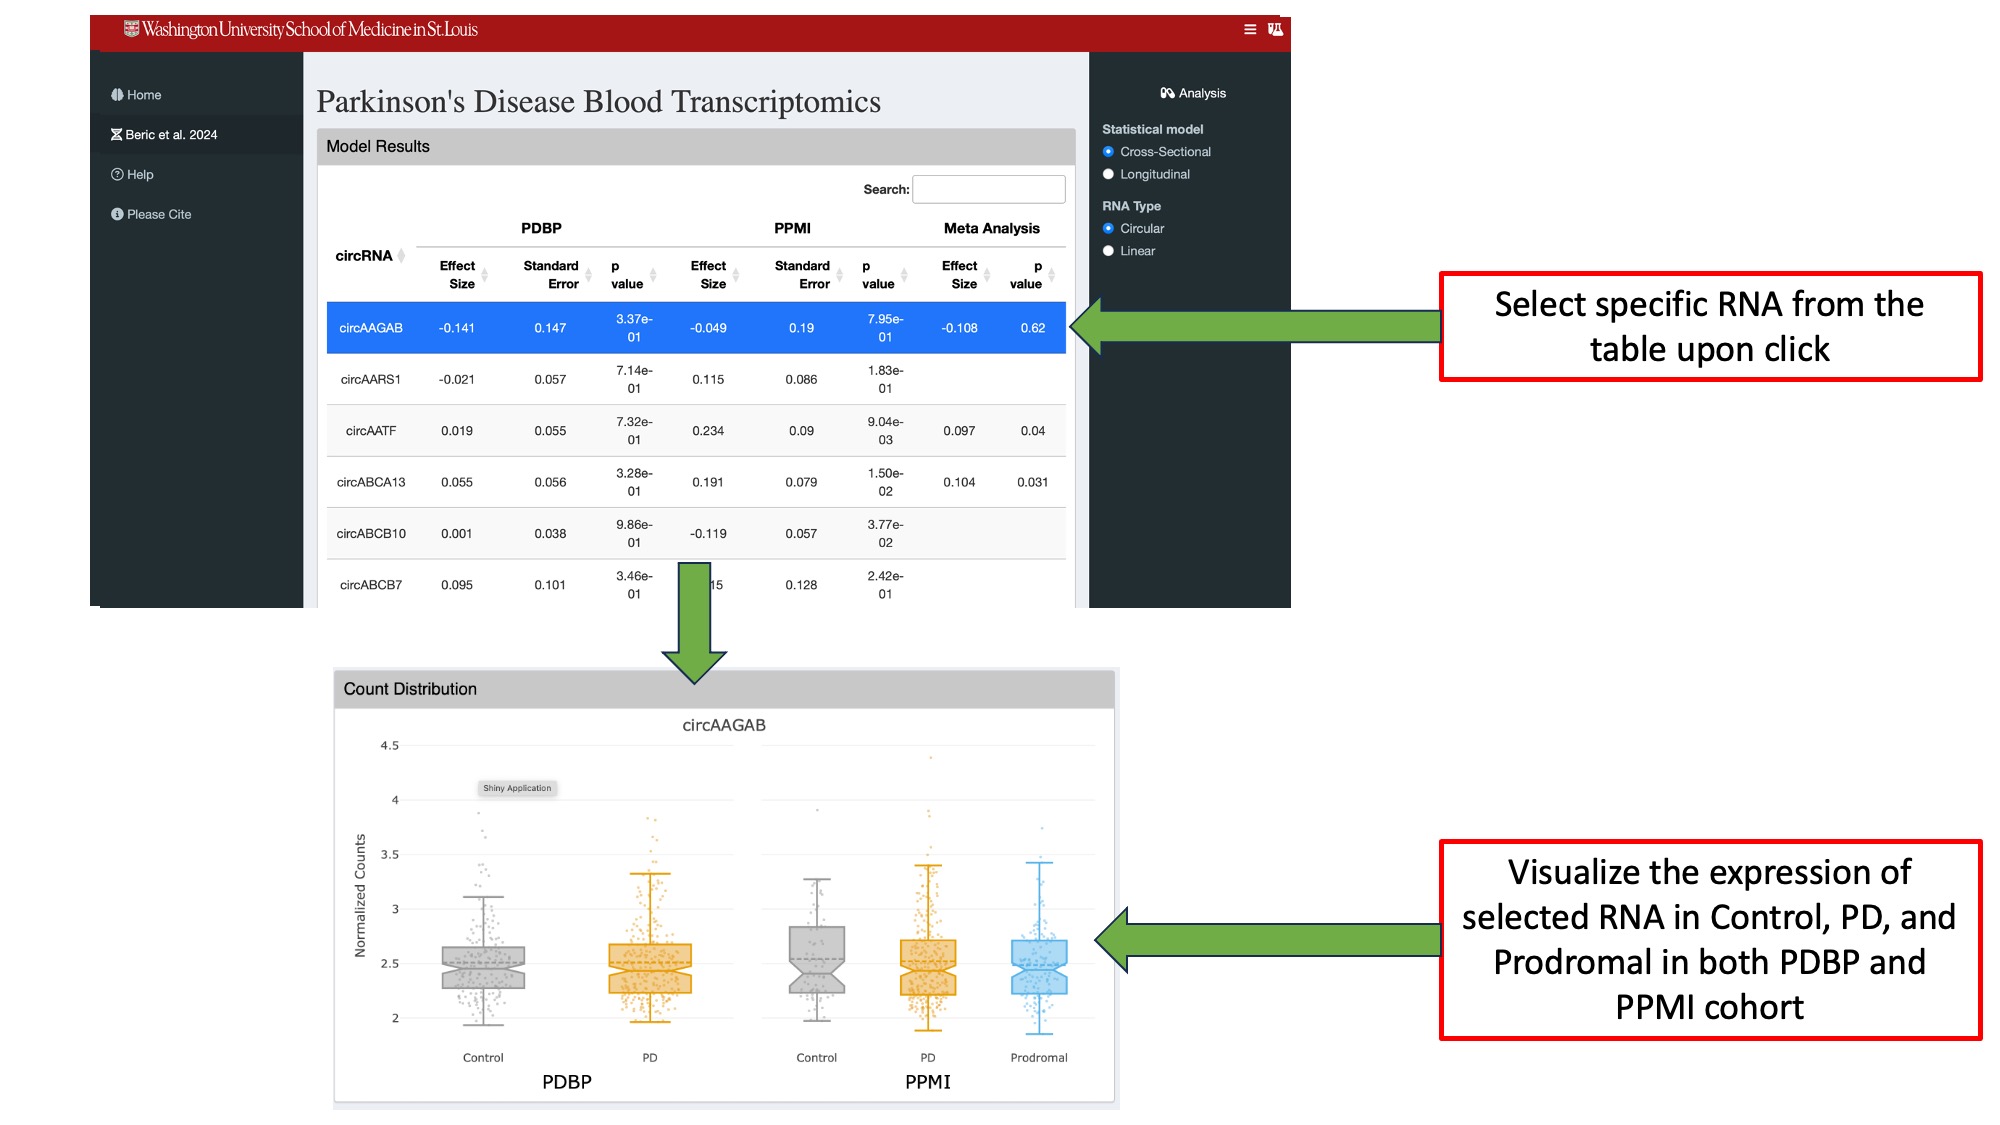
Figure 3 shows the expression of selected RNA in control, PD, and Prodromal in both PDBP and PPMI cohort.

Figure 3. Visualizaation of selected RNA in box plot.
More Information
If you use the data, please cite this paper
Beric et al. 2024 Circulating blood circular RNA in Parkinson’s Disease; from involvement in pathology to diagnostic tools in at-risk individuals.
If you wants to know more about the projects, please visit the lab page .